From live capture to deep dissection, Wireshark gives you field-level visibility across thousands of protocols. Use display filters, stream reconstruction, and expert analysis to isolate faults, prove compliance, and document what actually crossed the wire.
3,000+Protocols
Live & offlineCapture modes
GPLOpen source
Core capability
Packet & Protocol Inspection
Every frame becomes a structured protocol tree: Ethernet, VLAN, IP, TCP/UDP, TLS, DNS, HTTP/2, VoIP, industrial fieldbuses, and community-maintained dissectors for emerging standards. The three-pane layout keeps list, detail, and hex views synchronized so you can pivot from a symptom in the summary column to the exact offset in the payload.
Colorized packet list with configurable columns and coloring rules
Display filters (tcp.port == 443, http.request) to narrow millions of frames instantly
Follow Stream for TCP, UDP, TLS, and HTTP to rebuild conversations
Expert Information highlights retransmissions, checksum errors, and anomalies
Find Packet dialog for string, hex, regex, and display-filter searches across captures
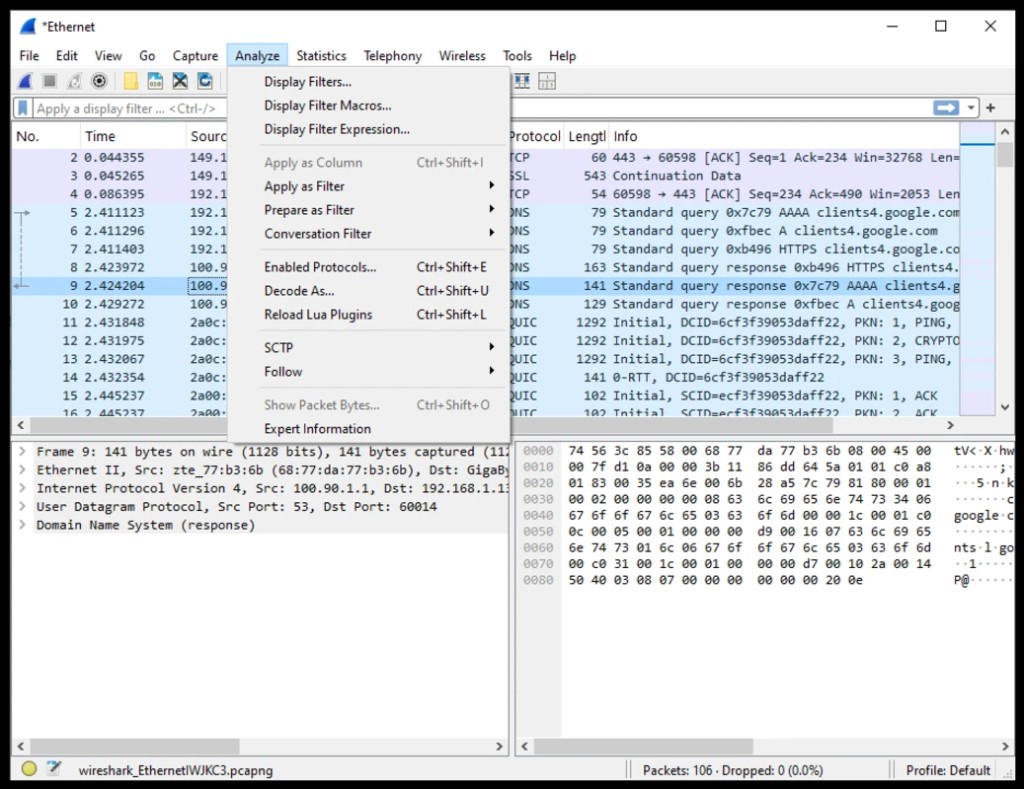
Analyze menu — display filters, expert info, and decode-as
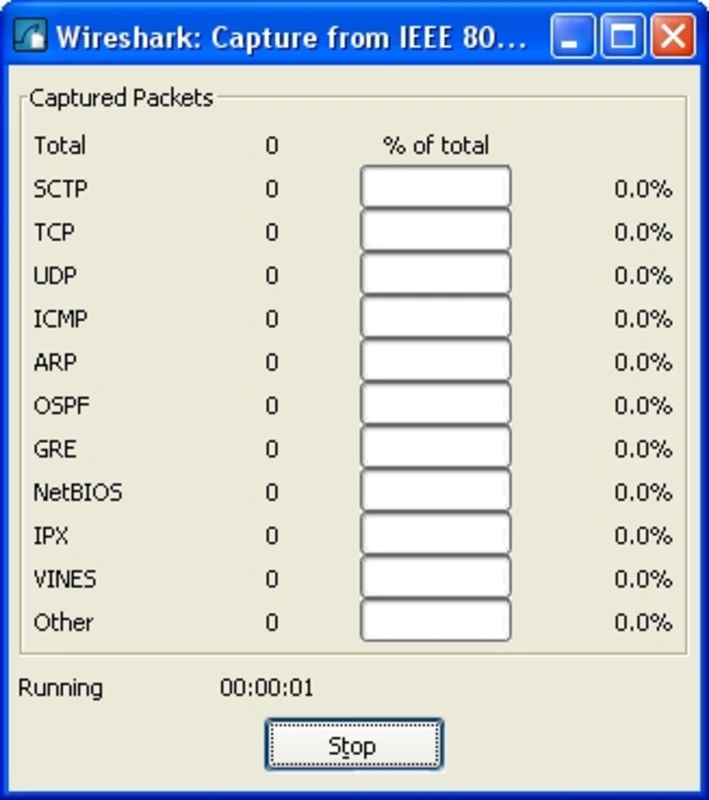
Live capture — protocol breakdown while a trace is running
Real-time visibility
Live Network Monitoring
Attach to wired, wireless, or virtual adapters and watch traffic as it arrives. Capture filters trim noise at the source; ring buffers and file rotation keep long-running captures manageable on busy links.
Multi-interface capture and remote capture via SSH or dedicated agents
BPF-style capture filters applied before packets hit disk
Merge PCAP/PCAPNG files and time-shift traces for before/after comparisons
Export subsets, anonymize fields, and share evidence with stakeholders
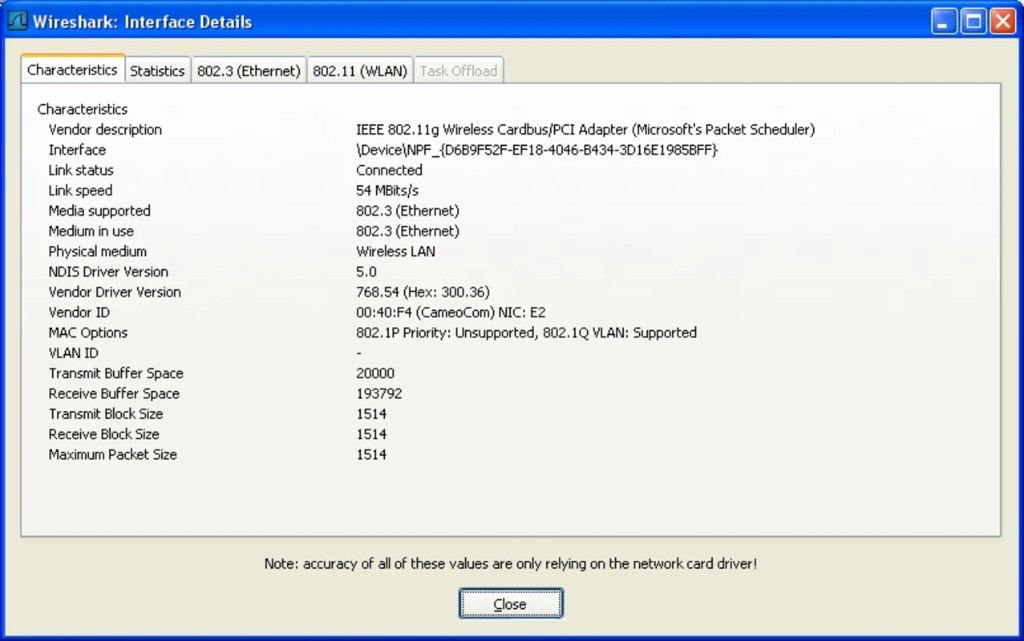
Raw frame capture needs OS-level access and accurate adapter metadata from the driver. Wireshark integrates with Npcap on Windows and libpcap on Unix-like systems, then surfaces vendor descriptions, link speed, and hardware capabilities in Interface Details.
Characteristics tab reports driver version, MAC options, and buffer sizes
Promiscuous mode and VLAN visibility depend on adapter and OS rights
Windows: install Npcap; elevate when the capture driver requires it
Linux/macOS: wireshark group or controlled sudo; grant macOS privacy prompts
Interface Details — adapter characteristics from the driver
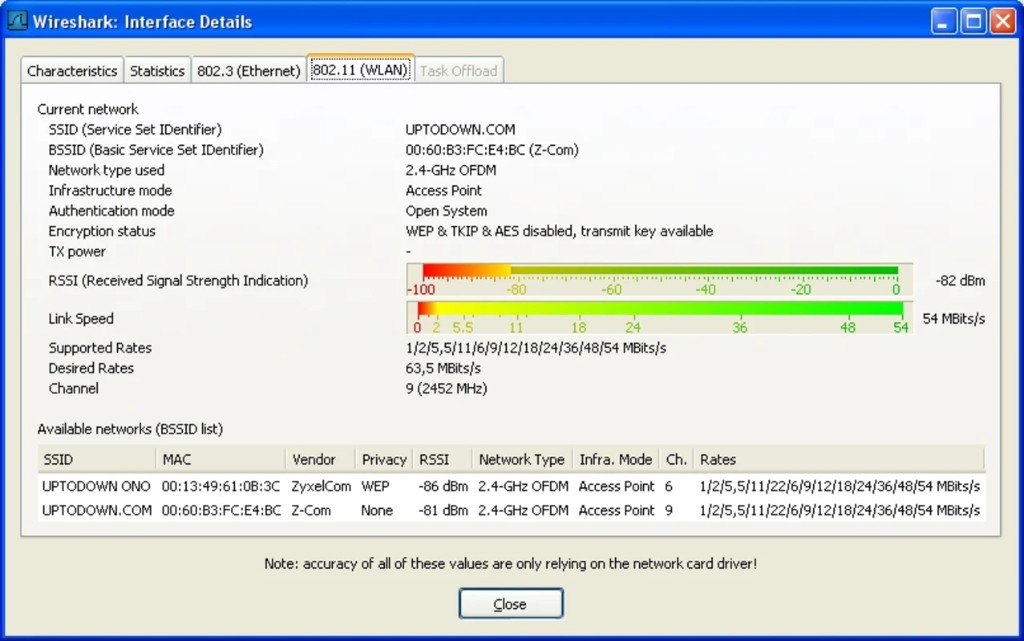
802.11 (WLAN) — signal strength, channel, and BSSIDs
Wireless telemetry
Performance & Traffic Insights
On Wi-Fi adapters, Wireshark exposes RSSI meters, negotiated link rates, channel placement, and discovered networks—so you can correlate application issues with RF conditions and roaming behavior.
Protocol Hierarchy and Conversations for volume by layer and peer
IO Graphs and TCP stream graphs for throughput, RTT, and retransmissions
WLAN tab lists SSID, BSSID, encryption, and nearby AP scan results
Export statistics and graphs for incident reports and capacity planning
Extensibility
Layout, Profiles & Plugins
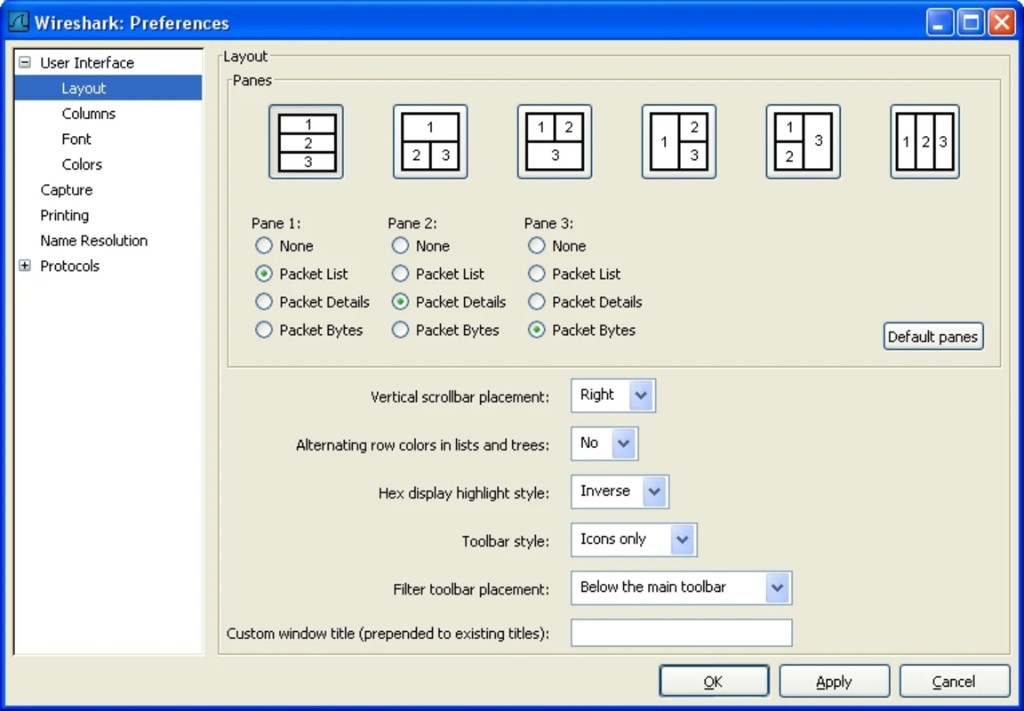
Preferences control how panes are arranged, how lists are colored, and how toolbars behave. Combine profiles with Lua scripts and dissector plugins to tailor Wireshark per team, customer, or protocol suite.
Assign Packet List, Details, and Bytes panes to any layout preset
C/C++ dissector plugins and decode-as for unknown ports
Lua for menus, tap listeners, and batch analysis
Coloring rules, columns, and decryption tables per profile
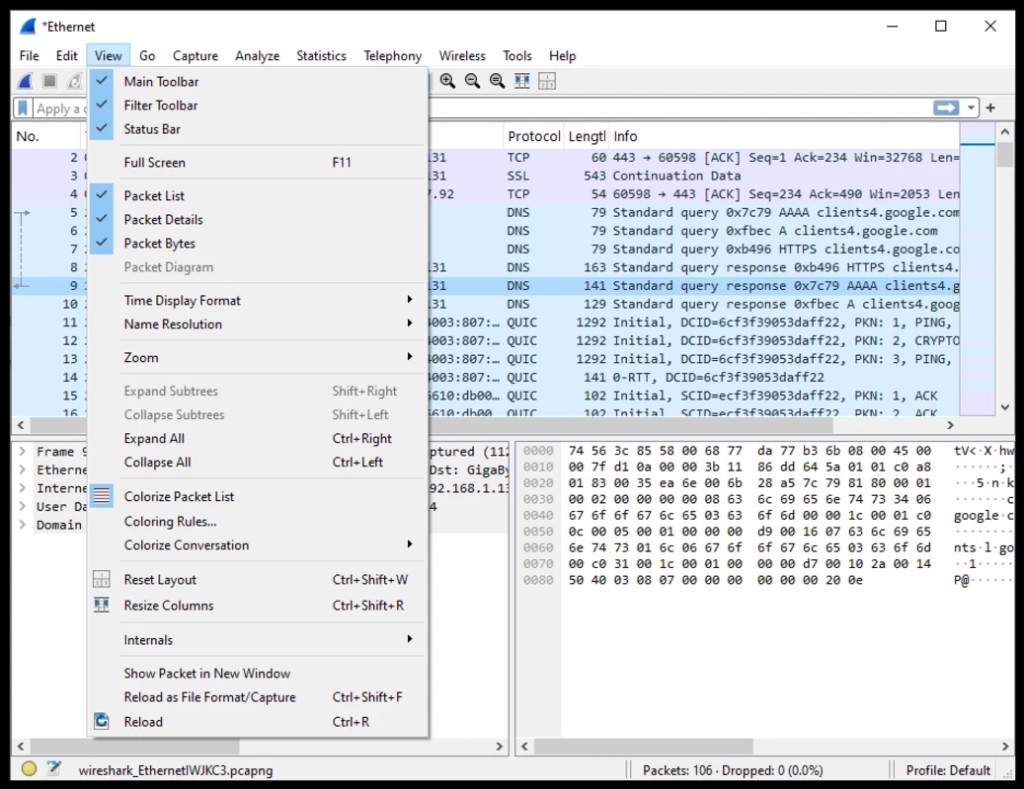
Toggle toolbars and panes, switch time formats, enable name resolution, and reset column widths without leaving the capture. Full-screen and layout reset help when presenting traces to stakeholders.
Show or hide packet list, details, bytes, and status bar
Colorize packet list and resize columns for readability
Time display formats from seconds to UTC timestamps
Name resolution for MAC, IP, port, and protocol labels
Trace workflow
Edit, Find & Mark Packets
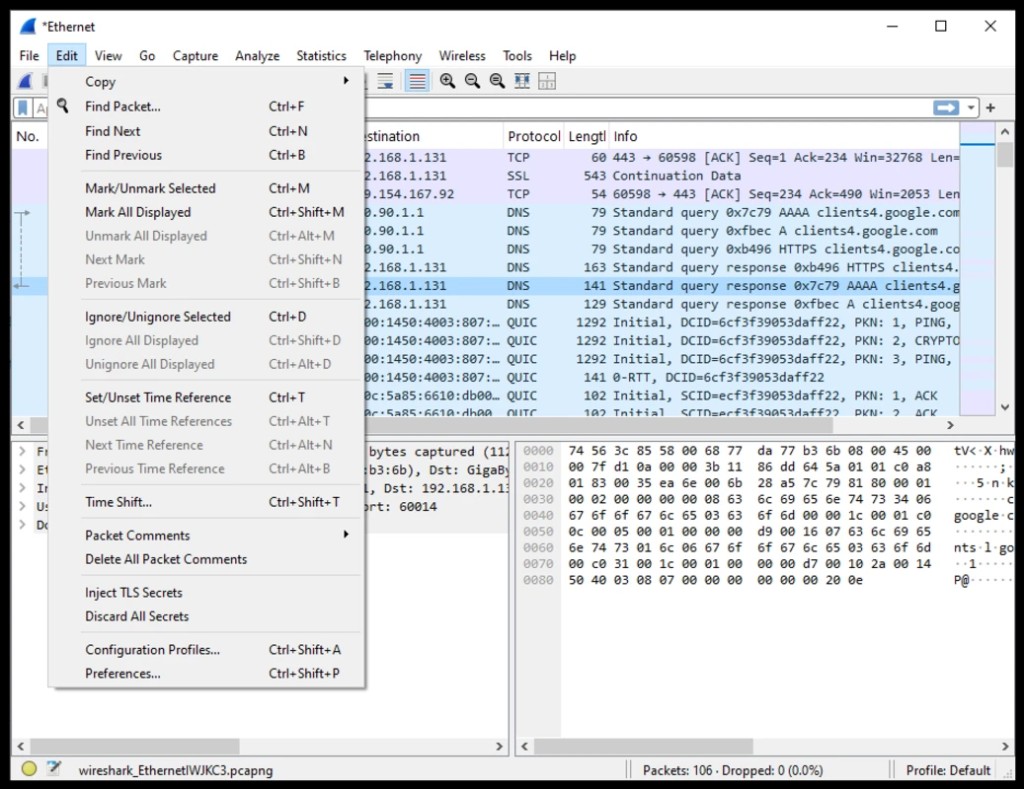
The Edit menu centralizes search, marking, and time references used in every investigation. Find Packet supports display filters, hex, and regex; marks help you build a working set inside large captures.
Find Packet with string, hex, regex, and display-filter modes
Mark, ignore, or set time reference on selected frames
Open Preferences for profiles, columns, and decryption
Combine with Analyze filters for repeatable triage steps
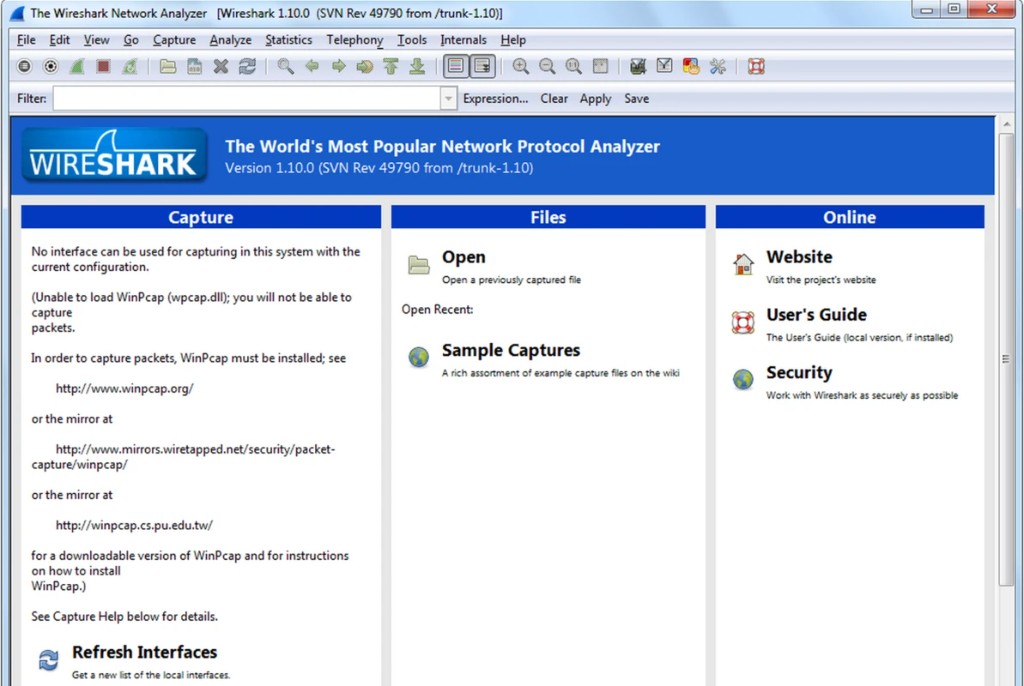
Welcome screen — capture, open files, and documentation
First launch
Capture, Files & Resources
The startup view groups everything you need before the first frame: pick an interface, open an existing PCAP, or jump to sample captures and the user guide. Capture troubleshooting appears inline when WinPcap/Npcap is missing.
Interface list with refresh when drivers are installed
Open previous captures and wiki sample trace files
Quick links to documentation, security advisories, and the website
Filter bar ready for display filters as soon as a file loads